File:Ending chart graph.png
Jump to navigation
Jump to search

Size of this preview: 799 × 288 pixels. Other resolutions: 320 × 115 pixels | 1,079 × 389 pixels.
Original file (1,079 × 389 pixels, file size: 281 KB, MIME type: image/png)
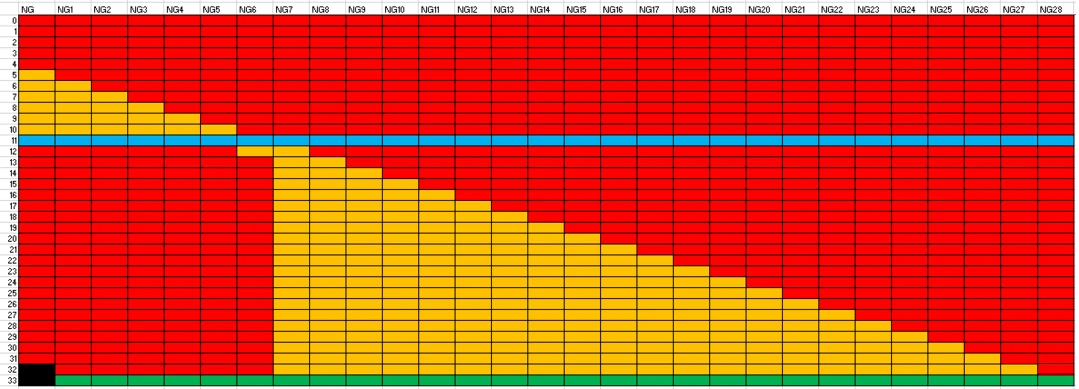
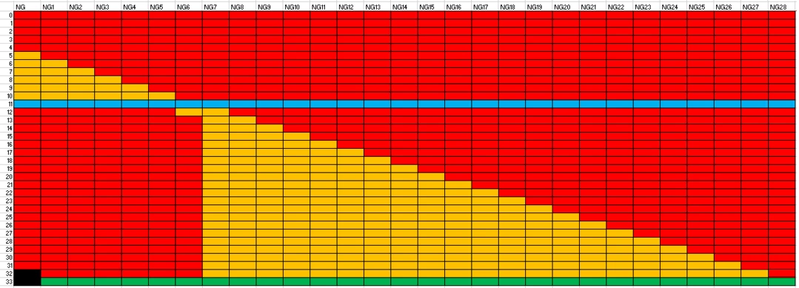
x axis is ng+ level (ng1 is normal), y axis is number of orbs. ending legend: black is inaccessible, red is toxic, green is peaceful, blue is pure, orange is ng+
File history
Click on a date/time to view the file as it appeared at that time.
| Date/Time | Thumbnail | Dimensions | User | Comment | |
|---|---|---|---|---|---|
| current | 21:57, 24 July 2021 | 1,079 × 389 (281 KB) | Davesoft (talk | contribs) | == Summary == Moved labels over to the right, ng was mislabelled ng1, and added ng28 column |
You cannot overwrite this file.
File usage
The following 2 pages use this file: